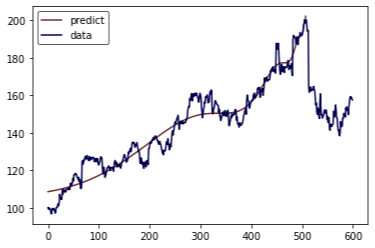
1
2
3
4
5
6
7
8
9
10
11
12
13
14
15
16
17
18
19
20
21
22
23
24
25
26
27
28
29
30
31
32
33
34
35
36
37
38
39
40
41
42
43
44
45
46
47
48
49
50
51
52
53
54
55
56
57
58
59
60
61
62
63
64
65
66
67
68
69
70
71
72
73
74
75
76
77
78
79
80
81
82
83
84
85
86
87
88
89
90
91
92
93
94
95
96
97
98
99
|
import numpy as np
import matplotlib.pyplot as plt
data = np.load('/AI/data.npy')
def fitness(A,B,C,w,Beta,Phi,t_c,t):
return (A + B*((t_c - t)**Beta)*(1+ C* np.cos(w*np.log(t_c - t)) + Phi))
def MAE(real, predict):
"""
Mean absolute error
as a measure of errors
"""
return(np.mean(abs(real[:len(predict)] - predict)))
def gene2coef(gene):
w = ((np.sum(2**np.arange(10)*gene[0:10]))*3.15/1023)+4
Beta = ((np.sum(2**np.arange(10)*gene[10:20]))*0.4)/1023 + 0.25
Phi = (np.sum(2**np.arange(10)*gene[20:30]))*2*np.pi/1023
t_c = np.rint(((np.sum(2**np.arange(10)*gene[30:40]))*15/1023)+500)
return w, Beta, Phi, t_c
def gene(N,G,survive_rate,mutation_rate):
mutation = round(N*40*mutation_rate)
survive = round(N*survive_rate)
pop = np.random.randint(0,2,(N,40))
fit = np.zeros((N,1))
for generation in range(G):
for i in range(N):
w, Beta, Phi, t_c = gene2coef(pop[i,:])
t_c = int(t_c)
M = np.zeros((t_c,3))
for t in range(t_c):
M[t,0] = 1
M[t,1] = (t_c-t)**Beta
M[t,2] = ((t_c-t)**Beta)*np.cos(w*np.log(t_c-t)+Phi)
ABD = np.linalg.lstsq(M,ln_data[:t_c],rcond=None)[0]
A,B,C = ABD[0], ABD[1], ABD[2]/ABD[1]
predict = np.zeros(t_c)
for t in range(t_c):
predict[t] = np.exp(fitness(A,B,C,w,Beta,Phi,t_c,t))
fit[i] = MAE(data,predict)
sortf = np.argsort(fit[:,0])
pop = pop[sortf,:]
for i in range(survive,N):
fid = np.random.randint(0,survive)
mid = np.random.randint(0,survive)
while(fid==mid):
mid = np.random.randint(0,survive)
mask = np.random.randint(0,2,(1,40))
son = pop[mid,:].copy()
father = pop[fid,:]
son[mask[0,:]==1] = father[mask[0,:]==1]
pop[i,:] = son
for i in range(mutation):
m = np.random.randint(0,N)
n = np.random.randint(0,40)
pop[m,n] = 1-pop[m,n]
for i in range(N):
w, Beta, Phi, t_c = gene2coef(pop[i,:])
t_c = int(t_c)
M = np.zeros((t_c,3))
for t in range(t_c):
M[t,0] = 1
M[t,1] = (t_c-t)**Beta
M[t,2] = ((t_c-t)**Beta)*np.cos(w*np.log(t_c-t)+Phi)
ABD = np.linalg.lstsq(M,ln_data[:t_c],rcond=None)[0]
A,B,C = ABD[0], ABD[1], ABD[2]/ABD[1]
predict = np.zeros(t_c)
for t in range(t_c):
predict[t] = np.exp(fitness(A,B,C,w,Beta,Phi,t_c,t))
fit[i] = MAE(data,predict)
sortf = np.argsort(fit[:,0])
pop = pop[sortf,:]
w, Beta, Phi, t_c = gene2coef(pop[0,:])
t_c = int(t_c)
M = np.zeros((t_c,3))
for t in range(t_c):
M[t,0] = 1
M[t,1] = (t_c-t)**Beta
M[t,2] = ((t_c-t)**Beta)*np.cos(w*np.log(t_c-t)+Phi)
ABD = np.linalg.lstsq(M,ln_data[:t_c],rcond=None)[0]
A,B,C = ABD[0], ABD[1], ABD[2]/ABD[1]
predict = np.zeros(t_c)
for t in range(t_c):
predict[t] = np.exp(fitness(A,B,C,w,Beta,Phi,t_c,t))
return A,B,C,w,Beta,Phi,t_c
|


